 |
VO-BB - 20 YEARS OLD!
Established November 10, 2004
|
| View previous topic :: View next topic |
| Author |
Message |
chrisvoco
Club 300
Joined: 14 Mar 2014
Posts: 380
Location: Local
|
 Posted: Tue Dec 02, 2014 9:11 pm Post subject: Waveform Visualization Posted: Tue Dec 02, 2014 9:11 pm Post subject: Waveform Visualization |
 |
|
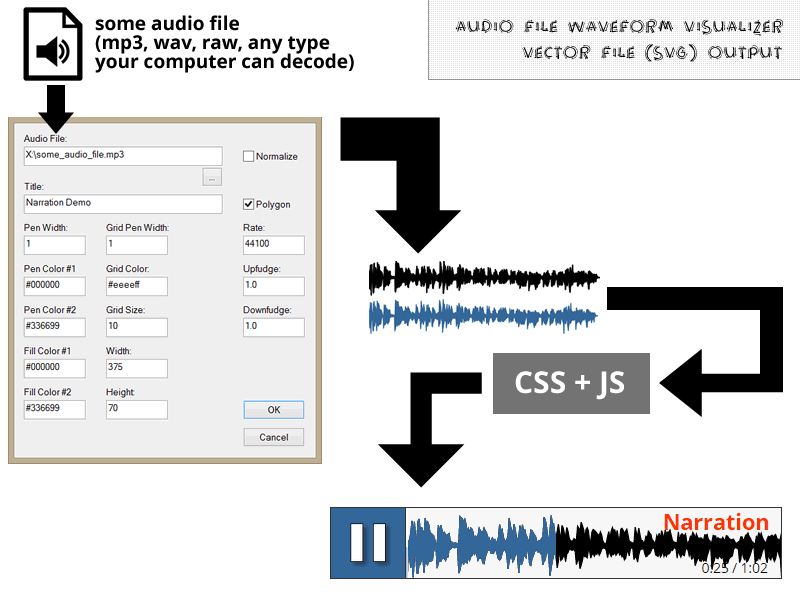
I needed a quick way to draw waveforms from audio data for projects not related to voice, but found that a bit of repurposing made it useful for web purposes. Wrote a small windows program to take an audio file and do the dirty work, given just a few parameters (color choices, pen sizes, whether you want a polygon or individual lines, etc.). It will accept any audio file format for which you have a decoder on your machine.
The diagram here shows the basic flow, and the waveforms in the diagram are real waveforms produced by the program. A one-minute stereo 256kbps mp3 takes maybe two seconds to process on my laptop with an i7, and the resulting SVG file is about 9KB (easily small enough for any purpose).
So, a la Soundcloud, you can make your own. It would be my pleasure to provide the program, free of charge. For some extra Oreos and The Macallan, I'll provide the javascript and css and markup to animate between the "played" and "unplayed" versions of the waveform image, calculate elapsed time, and jump playback to any point in the audio corresponding to where you click on the waveform image itself.
Or you can just steal it from me. Anyway, anybody has a use for a program to produce nicely-drawn waveforms in the sizes and colors of your choice, you can have it for free - just lemme know.
_________________
Finally, Ford stops starting to say things and starts. |
|
| Back to top |
|
 |
Lee Gordon
A Zillion

Joined: 25 Jul 2008
Posts: 6868
Location: West Hartford, CT
|
| Posted: Wed Dec 03, 2014 2:49 am Post subject: |
|
|
That's pretty cool, but now you have me wondering, is there a program that does this in reverse? What I mean is, is there any way to copy the graphical representation of a waveform and convert it back to audio? That would be pretty cool, too.
_________________
Lee Gordon, O.A.V.
Voice President of the United States
www.leegordonproductions.com
Twitter: @LeeGordonVoice
 |
|
| Back to top |
|
|
chrisvoco
Club 300
Joined: 14 Mar 2014
Posts: 380
Location: Local
|
| Posted: Wed Dec 03, 2014 6:35 am Post subject: |
|
|
The short answer is yeah, sure. The longer answer is that the result *might* sound vaguely like the original audio (though that's a gamble), and would definitely sound pretty bad.
In any sampling operation, data is irretrievably lost. In my program, that's done pretty carelessly. Each pixel over the width of the output graphic has to represent a bunch of samples from the audio. This means you go through the file, iterate over each n samples and find the local extrema. For polygonal output, you plot in clockwise order - from 9 o'clock to 3 o'clock, you plot all the maximums from start to finish, and from 3 o'clock to 9 o'clock you plot the minimums from finish to start. The result is my approximated waveform, which is just accurate enough for visualization. The difference in the amount of data in your audio file and the amount of data that represents that data in the output graphic is tremendous, with most of it thrown away.
So, the graphic simply does not have all of the peak information that's present in your audio file - just as your audio file does not have all the peak information that's present in your original source audio, but on an enormously, sloppily greater scale.
But I already intended to write a routine to try it out, just for fun. This falls squarely into the "just because you can do something doesn't mean you should" zone. It's like making a sampler out of a single input pin on a parallel port and a single capacitor, or making your own beer: it probably won't taste very good, but you're going to do it anyway. 
_________________
Finally, Ford stops starting to say things and starts. |
|
| Back to top |
|
|
georgethetech
The Gates of Troy

Joined: 18 Mar 2007
Posts: 1878
Location: Topanga, CA
|
| Posted: Thu Dec 04, 2014 7:03 pm Post subject: |
|
|
The Waveform displayed only contains two piece of info: Time and Volume. It lacks information on frequency, though. But a Spectral view, now THAT'd be more possible! If I want an image of a Waveform, I just take a screenshot of the waveform in my DAW.
_________________
If it sounds good, it is good.
George Whittam
GeorgeThe.Tech
424-226-8528
VOBS.TV Co-host
TheProAudioSuite.com Co-host
TriBooth.com Co-founder |
|
| Back to top |
|
|
chrisvoco
Club 300
Joined: 14 Mar 2014
Posts: 380
Location: Local
|
| Posted: Thu Dec 04, 2014 7:22 pm Post subject: |
|
|
The sample itself contains only volume, as does the original source sound in the physical world: frequency is how the amplitude changes over a period of time. A graph of spectral content tells you less, for this purpose, than the waveform. Harmonics that make the timbre are, as well, functions of this modulation - if you have the waveform, you have the sound.
Screenshot is fine, sure, but see that I needed an automated process. This originated from a fairly heavy duty DSP project for which screenshots would certainly not suffice. Also, speed - screenshot you gotta edit, size, etc., terribly inefficient if you have about a thousand at a time.
I'll be happy to provide the relevant source code if you'd like to see, by the way.
You certainly could, at some resolution, reproduce accurately from an image. I'll Rube Goldberg up a small utility to prove it.
_________________
Finally, Ford stops starting to say things and starts. |
|
| Back to top |
|
|
chrisvoco
Club 300
Joined: 14 Mar 2014
Posts: 380
Location: Local
|
| Posted: Thu Dec 04, 2014 7:42 pm Post subject: |
|
|
And I'll take the first, most basic thought on how: edge-detect the waveform image. Then, work against a horizontal line segment drawn across the duration of the waveform at every possible sample value for a given depth. Detect collisions, from left to right, between the waveform polygon and each of our imaginary horizontal lines.
This is surely not the best way, but will be fun.
...and after a second think, finding edges isn't even necessary. It's going to be even easier than that. Film at eleven!
_________________
Finally, Ford stops starting to say things and starts. |
|
| Back to top |
|
|
heyguido
MMD
Joined: 31 Aug 2011
Posts: 2507
Location: RDU, the Geek Capitol of the South
|
| Posted: Fri Dec 05, 2014 1:35 am Post subject: |
|
|
Step away from the sonic hashpipe.... 
The traditional means in which even the most sophisticated of daws, media players, etc, display waveforms is a joke.... A fake, and at best, a shallow attempt at representing the true nature of the real sonic artifact.
Call me a digital fool, but I relish listening to you replicate reality...
I don't deny the possibility, but I welcome the comparison.... 
_________________
Don Brookshire
"Wait.... They wanna PAY me for this?" |
|
| Back to top |
|
|
chrisvoco
Club 300
Joined: 14 Mar 2014
Posts: 380
Location: Local
|
| Posted: Fri Dec 05, 2014 5:08 am Post subject: |
|
|
No, you wont take just any old waveform graphic and make a reasonable sound from it, but two things to note here:
First, consider that a waveform image is essentially a resampling of a resampling. Let's say that both the audio sample and the visualizaton are just two bitmaps of the same thing.
Second, yes, the display in a daw or a media player or wherever does not have the full amount of data needed to reproduce very cleanly. Consider that you get some relatively small number of pixels along both the time and amplitude axes. Because of the need for speed, the output area and the purpose, you don't even need anything close to 100% of the sample data represented with almost any precision at all, and that you can zoom in if you do.
And the gripping hand is on that last part. I will post links to some images and actual output from my progress so far later today.
_________________
Finally, Ford stops starting to say things and starts. |
|
| Back to top |
|
|
chrisvoco
Club 300
Joined: 14 Mar 2014
Posts: 380
Location: Local
|
| Posted: Fri Dec 05, 2014 6:50 am Post subject: |
|
|
And, quoting myself:
| Quote: | The difference in the amount of data in your audio file and the amount of data that represents that data in the output graphic is tremendous, with most of it thrown away.
So, the graphic simply does not have all of the peak information that's present in your audio file - just as your audio file does not have all the peak information that's present in your original source audio, but on an enormously, sloppily greater scale. |
Anyway, onward and upward. Some preliminary and thus relatively weak results coming soon.
_________________
Finally, Ford stops starting to say things and starts. |
|
| Back to top |
|
|
chrisvoco
Club 300
Joined: 14 Mar 2014
Posts: 380
Location: Local
|
| Posted: Fri Dec 05, 2014 10:25 am Post subject: |
|
|
Preliminary hoo-hah here.
The original sound clip:
http://chrisvo.co/randomstuff/gold-from-lead/5sec.wav
The enormous bitmap of the waveform (warning, it's about 40MB):
http://chrisvo.co/randomstuff/gold-from-lead/testwaveform.bmp
The raw pcm output after sampling the image:
http://chrisvo.co/randomstuff/gold-from-lead/outwave.raw
The nasty rendered wav of it:
http://chrisvo.co/randomstuff/gold-from-lead/transitional.wav
Now, *preliminary* is the key adjective, here. Sample rate to get close to correct pitch is about 2.3kc, so if you import the raw file, set the rate around there. The effective rate, though, that you actually hear, gives me very limited spectrum. But that's okay for now.
Without knowing the original, it's nigh-unintelligible, of course, but the general gist is there. Pitch in the result is a bit off, because I'm guessing at a few things. The quick-and-dirty is that, once I have a big array of samples, for each timeslot (pixel) from left to right, I get a max and a min, then average them (yes, yes, a regular average is not appropriate for sound, but I'm in a hurry), then decide how many additional samples need to go between each sample and ramp values up or down as needed betwixt.
More to come, along with an executable.
It's certainly doable, but much like making gold from lead: the cost and time is more expensive than what you wind up with...
_________________
Finally, Ford stops starting to say things and starts. |
|
| Back to top |
|
|
Lee Gordon
A Zillion
Joined: 25 Jul 2008
Posts: 6868
Location: West Hartford, CT
|
| Posted: Fri Dec 05, 2014 10:52 am Post subject: |
|
|
| chrisvoco wrote: | | much like making gold from lead: the cost and time is more expensive than what you wind up with... |
But if you manage to do it, you're a star.
_________________
Lee Gordon, O.A.V.
Voice President of the United States
www.leegordonproductions.com
Twitter: @LeeGordonVoice
|
|
| Back to top |
|
|
chrisvoco
Club 300
Joined: 14 Mar 2014
Posts: 380
Location: Local
|
| Posted: Fri Dec 05, 2014 10:57 am Post subject: |
|
|
Send me a five second waveform image. Make the image as large as reasonably possible. Mono. Dry, please.
_________________
Finally, Ford stops starting to say things and starts. |
|
| Back to top |
|
|
chrisvoco
Club 300
Joined: 14 Mar 2014
Posts: 380
Location: Local
|
| Posted: Fri Dec 05, 2014 6:02 pm Post subject: |
|
|
Looking around a bit, this is already done to varying degrees - notably with... paper! Forgot about that until this evening; I'd read a story about it quite a while ago. I'll try to find a link to it and pass along because it's pretty cool.
I found that there are a number of libraries to draw you a waveform more or less on the fly - perhaps the most shiny and interesting of these is waveform.js. It depends on the audio being on SoundCloud, leaving the calculating to the user's browser, though, which did not fit within my particular constraints.
Meanwhile, my original point was: a small, fast and automatable means to chug out nice-looking waveform images, at entirely arbitrary physical dimensions, that can then be used with reckless abandon, requiring no computational hoo-hah on the part of whoever's consuming your visual doodads. That's all.
...but I'm still happy to try to show off with the reverse process. Found a few examples of audio reproduced from waveform images by different methods, but nearly all of them suck, some even *worse* than my initial example here. Yes, I think I can do it better. I have some tricks to try, predictive nonsense and general holistic crap that's worth an experiment or ten.
_________________
Finally, Ford stops starting to say things and starts. |
|
| Back to top |
|
|
Foog
DC
Joined: 27 Oct 2013
Posts: 608
Location: Upper Canuckistan
|
| Posted: Sun Dec 07, 2014 11:13 pm Post subject: |
|
|
This is a way cool experiment! Reminds me of the plant leaves/bag-of-chips vibrations-to-sound video experiment thingie they did a while ago: http://youtu.be/FKXOucXB4a8
_________________
Andrew Fogarasi
|
|
| Back to top |
|
|
|
|
You cannot post new topics in this forum
You cannot reply to topics in this forum
You cannot edit your posts in this forum
You cannot delete your posts in this forum
You cannot vote in polls in this forum
|
Powered by phpBB © 2001, 2005 phpBB Group
|

